
|
Nimbus
0.9.3 - Nimbus is proudly hosted on Github
An iOS framework whose growth is bounded by O(documentation).
|
Overview
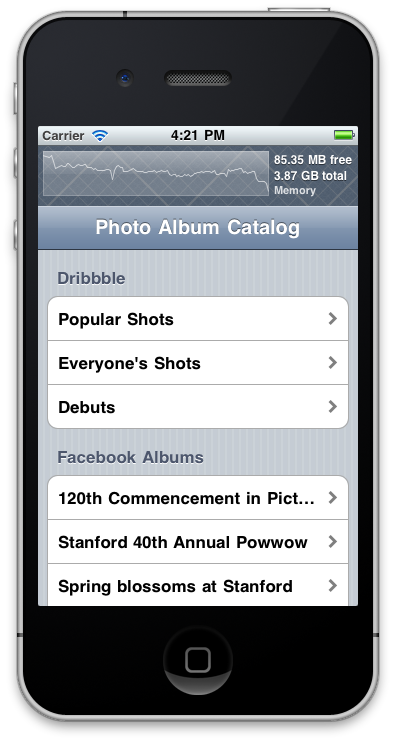
The Overview is a debugging tool for quickly understanding the current state of your application.
When added to an application, it will insert a paged scroll view beneath the status bar that contains any number of pages of information. These pages can show anything from graphs of current memory usage to console logs to configuration settings.
Built-in Overview Pages
The Overview comes with a few basic pages for viewing the device state and console logs.
NIOverviewMemoryPageView
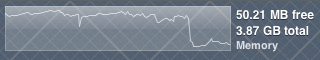
This page shows a graph of the relative available memory on the device.
NIOverviewDiskPageView
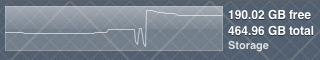
This page shows a graph of the relative available disk space on the device.
NIOverviewConsoleLogPageView
This page shows all messages sent to NSLog since the Overview was initialized.
NIOverviewMaxLogLevelPageView
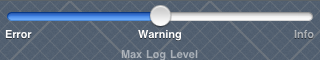
This page allows you to modify NIMaxLogLevel while the app is running.
How to Use the Overview
To begin using the Overview you need to add two lines of code to your app and define DEBUG in your applicaton's preprocessor macros Debug target settings.
 - (BOOL)              application:(UIApplication *)application
    didFinishLaunchingWithOptions:(NSDictionary *)launchOptions {
  // Line #1 - Swizzles the necessary methods for making the Overview appear as part of the
  // the status bar.
  [NIOverview applicationDidFinishLaunching];

  // After you create the UIWindow for your application and add the root view controller,
  // i.e.:
  [self.window addSubview:_rootViewController.view];

  // then you add the Overview view to the window.
  [NIOverview addOverviewToWindow:self.window];
Events
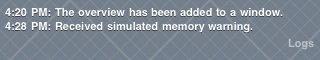
Certain events are useful in providing context while debugging an application. When a memory warning is received it can be helpful to see how much memory was released. for example.
The Overview visually presents events on Overview graphs as vertical lines. Memory warnings are red.
In the screenshot below, you can see when a memory warning occurred and the resulting increase in available memory.

How the Overview is Displayed
The Overview is displayed by tricking the application into thinking that the status bar is 60 pixels larger than it actually is. If your app respects the status bar frame correctly then the Overview will always be visible above the chrome of your application, directly underneath the status bar. If the status bar is hidden, the Overview will also be hidden.
Creating a Custom Page
You can build your own page by subclassing NIOverviewPageView and adding it to the overview via [[NIOverview view] addPageView:].
Modules | |
| Sensors | |
| Overview | |
| Logger | |
| Pages | |
 1.7.4-20110629